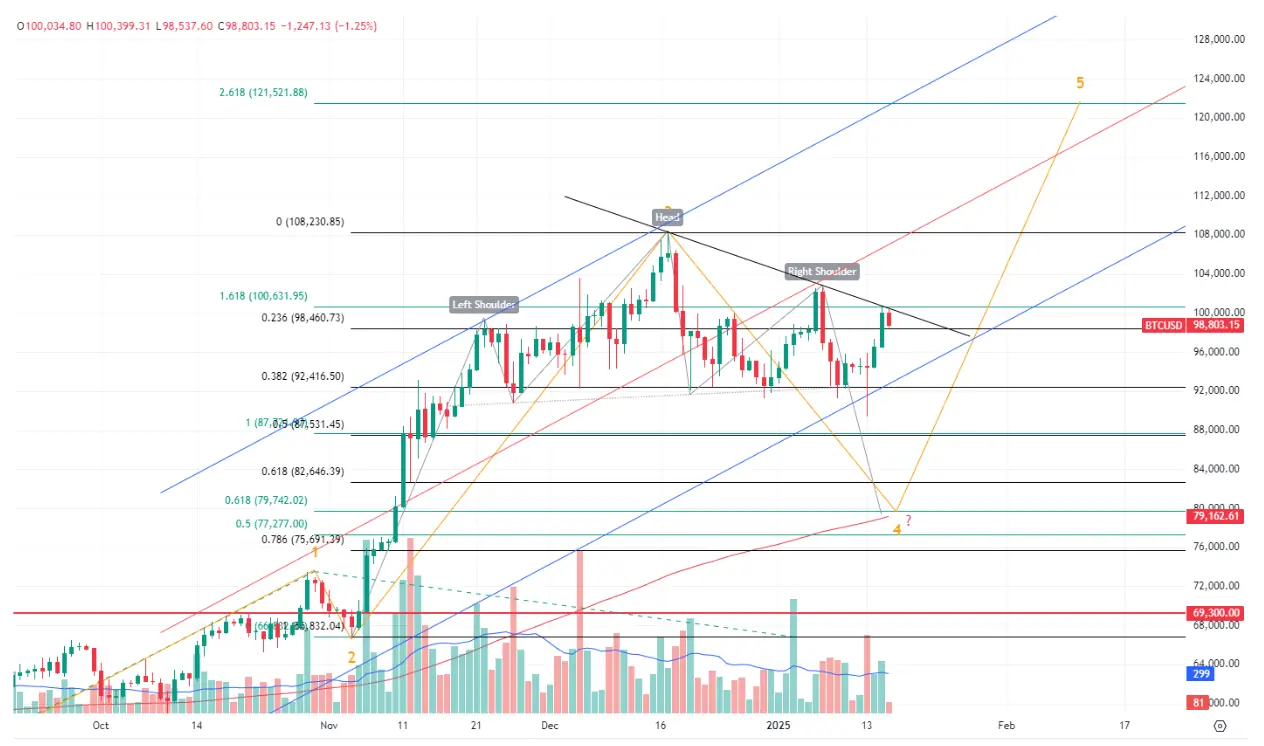

Bitcoin Price Analysis: BTC Consolidates Between $90K-$100K
Market Overview: BTC/USD Trading Pattern
BTC/USD continues to trade in consolidation mode as of writing on Thursday, January 16.
In our view, market uncertainty will persist at least until President-elect Donald Trump takes office on January 20, with a bout of volatility likely to follow.
Recent Price Action: Key Breakout Attempts
Bitcoin has been fluctuating in a broad range between $90k and $100k YTD, with sporadic breakout attempts.
One such attempt occurred on Monday, January 6 when the price action tested the $102,500 local high before swiftly retracing back to the previous channel.
In a more recent example, the bears tried and failed to push below $90k on Monday, January 13.
Expert Analysis
Analysts at Standard Chartered argue as well that a breakout below $90k would herald a pullback toward $80k or even lower.
Thomas Lee, head of research at Fundstrat Global Advisors, said in an interview with CNBC that bitcoin will most likely decline to $50k-70 before mustering a new leg higher.
BTC looks like an increasingly mature asset, according to Lee, as recent pullbacks have been milder than they used to be.
For instance, the market experienced 20-30% meltdowns in 2021-2022, whereas the most recent steep corrections have typically been limited to the range of 10-15%.
Technical Analysis: Fourth Wave Scenario
From the standpoint of technical analysis, the scenarios outlined in our previous BTC/USD overviews remain in play.
To remind, we referenced two possibilities – either the end of the fourth corrective wave followed by an extension of the impulse uptrend or an extension of the fourth wave with further downside potential.
As long as BTC/USD struggles to retrace to its all-time highs, it is safe to assume that the fourth corrective wave is still in play. This means that bitcoin does hold downside potential, in line with Tom Lee’s thinking.
Given that BTC/USD has not reached new highs since our last overview, the fourth wave still appears to be in place, implying a potentially deeper correction, in line with Lee’s rationale.
To remind, we previously considered the formation of an inverse head-and-shoulders pattern, with the first local high (left shoulder) at $99.3k, the highest since November 22, 2024, the ATH of $108k (head) and the second local high (right shoulder) near $100k.
This scenario could materialize if the price action breaches the pattern’s neck ($90-95k), thus completing the formation. Unfortunately for the bears, this did not occur.
However, it should be noted that this remains a plausible scenario, albeit with a slightly lower probability.
The pattern’s right shoulder could be the highs seen from January 6 to January 7.
The problem is that the right shoulder looks higher than the left one, calling into question the reliability of this scenario.
However, a breakout of $90k to the downside would almost certainly portend a pullback to $80k, where the 200-day SMA currently lies.
Alternatively, a rebound to new highs would imply that the correction is over, and that would mean that the formation of the fifth wave to $120-130k would be about to start.


