Solana Price Analysis: SOL Faces Bearish Q1 After January ATH
Q1 Performance: Monthly Breakdown and Key Statistics
The price action for Solana (SOL) reversed lower in the second half of January.
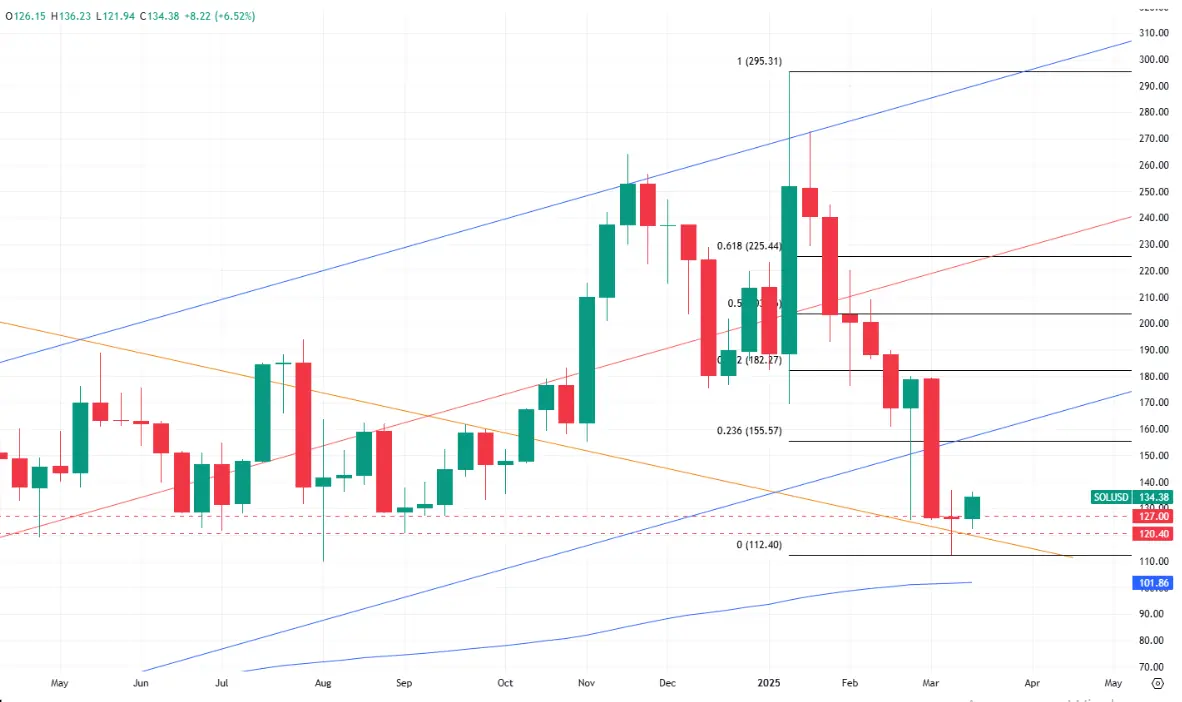
Prior to that shift, SOL had hit ATHs, briefly trading at USD 295.30.
In the current quarter, January was the best month, with SOL up 22.5% – still underperforming relative to some of the gains in previous months.
The token slid 36% in February and 10% in March. Importantly, Glassnode noted that SOL slipped below USD 134 in March, an average value for investment purchases.
Memecoin Revenue Decline: The Primary Catalyst
Experts note that sentiment has fundamentally deteriorated on the heels of declining revenues for Solana.
Asset management firm VanEck issued an overview, saying that “one of the biggest drivers of Solana’s growth has been memecoin trading, which accounts for approximately 80% of its revenues."
"The most successful platform for memecoin launches, Pump.fun, operates on Solana.
Pump.fun allows users to quickly and cheaply create and trade memecoins, charging a 1% fee on trading volume.
Pump.fun has generated more than USD 577 mn in fees in just over a year, making it one of the most profitable applications in crypto history…
In February, Solana suffered significant losses due to a collapse in memecoin trading,” according to the overview.
VanEck Analysis: SIMD Upgrades Could Stabilize SOL
Despite the downturn, VanEck remains cautiously optimistic: “Solana has several upcoming protocol upgrades, known as SIMDs, to improve its technical capabilities and economic framework.
These changes could help stabilize and enhance Solana’s position in the crypto ecosystem moving forward.”
Technical Outlook: Short-Term Bears vs. Long-Term Bulls
From a technical perspective, SOL has dipped towards strong support in the USD 120-130 range.
On the daily chart, the regression channel as well as the 200-day MA show a downward bias, meaning that the short-term trend is decidedly bearish.
Conversely, the longer-term weekly timeframe presents a more upbeat outlook.
The bulls stand a chance of mustering a rebound, with the next target at USD 155.50 where one of the Fibonacci retracement levels and the previous regression line are located.
Should this scenario play out successfully, both a pullback and a breakout to the upside could in the cards.
That said, it is too soon to price in this assumption.